Introduction
Most companies collect data at scale but still struggle to get clear answers when decisions are on the line.
That gap is real: 77% of business users say IT can't keep up with their data requests, and 85% say sourcing new data takes too much time and effort, according to a 2021 TDWI survey.
Dashboards pile up. Spreadsheets multiply. Decisions still get made on gut feel.
A business intelligence strategy paired with a big data approach is what separates organizations that act on their data from those buried under it. This guide covers the fundamentals of BI and big data, the four pillars of a solid strategy, the five maturity stages companies move through, and a practical roadmap for building your own.
Key Takeaways
- A BI strategy is a structured roadmap for collecting, governing, and using data, not a shopping list of software
- BI interprets what's already happened; big data techniques help predict what's next
- Four pillars underpin every mature BI program: infrastructure, governance, tools, and culture
- Organizations typically move through five maturity stages, from spreadsheets to automated decisions
- Executive sponsorship and a dedicated cross-functional team matter more than the software you buy
What Is Business Intelligence and Big Data?
Business intelligence is the process of collecting, analyzing, and presenting data so people can make faster, better decisions. Microsoft frames it as a four-step cycle: collect data, analyze it, visualize it, and act on it.
Big data describes datasets defined by volume, variety, and velocity, too large or fast-moving for traditional tools to handle efficiently. Gartner's official definition ties big data to information assets that demand "cost-effective, innovative forms of information processing" to generate insight and enable automation.
Here's how they work together: BI structures and reports on data you already have. Big data techniques—such as machine learning on years of sensor or transaction data—uncover patterns at scale that signal what's coming next. One looks backward with precision. The other looks forward with probability.
Three terms get blurred in most planning conversations:
- BI strategy — how you report on and interpret existing data for decisions
- Data strategy — how you collect, store, and govern data across the organization
- Analytics strategy — how you apply statistical and predictive methods to that data
Name which of the three you mean before you write an RFP—it keeps vendor talks focused and short.
Is Business Intelligence the Same as ETL?
No. ETL (extract, transform, load) is one piece of the BI ecosystem, not a substitute for it. Microsoft describes ETL as the process that consolidates data from multiple sources, cleans and shapes it, then loads it into a data warehouse. BI tools then query that warehouse to build reports and dashboards. Without ETL, your BI tool has nothing reliable to analyze. Without BI, your clean data warehouse has no way to speak to the business.
The Four Pillars of a Business Intelligence Strategy
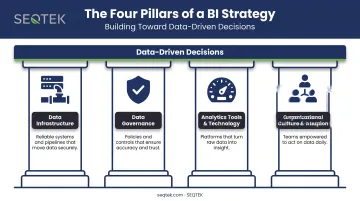
A durable BI strategy rests on four interconnected pillars. Weaken one, and the whole structure wobbles.
1. Data infrastructure This is the technical foundation: connecting CRM, ERP, and operational systems, then keeping data fresh through automated pipelines rather than manual exports. Stale or fragmented data undermines trust before anyone even opens a dashboard.
2. Data governance Governance means agreed-upon metric definitions, tiered data certification (so everyone knows which numbers are "trusted" versus draft), and access controls that protect sensitive information while keeping data usable. Without this, two departments will report different revenue numbers in the same meeting.
3. Analytics tools and technology The right BI platform supports self-service exploration for business users while integrating cleanly with your existing data sources. Tool selection matters less than fit: a powerful platform nobody can navigate is worse than a simple one people actually open.
4. Organizational culture and adoption Role-based data literacy training turns tools into habits. This pillar is where most strategies fail, because tools mean nothing without adoption.
That adoption gap is measurable. Forrester found that only 48% of business decisions in 2022 were based on quantitative data and analysis. More than half of decisions still lean on something other than the numbers sitting in your dashboards.
Building Your Business Intelligence Strategy: Key Steps
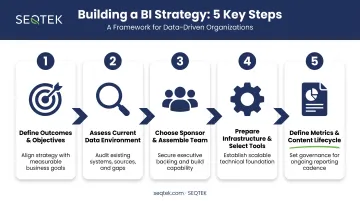
A BI strategy starts with decisions, not software. Build it in this sequence.
- Define outcomes and objectives. Build a decision inventory: a plain list of what each team actually needs to know to do their job better. Skip this, and you'll build dashboards nobody asked for.
- Assess your current data environment. Map data lineage and discoverability. Where do silos exist? Where are people manually pulling reports because nothing talks to anything else?
- Choose an executive sponsor and assemble a BI team. Clear roles matter: data engineers to build pipelines, analysts to interpret output, stewards to enforce governance.
- Prepare infrastructure and select tools. Prioritize self-service capability and integration breadth over flashy features.
- Define metrics, documentation, and a content lifecycle. Without this, dashboard sprawl sets in fast, and trust in the numbers erodes.
Each step compounds on the one before it. Skip the decision inventory and jump straight to tool selection, and you'll end up governing data nobody uses.
This is also where an outside partner earns its keep. SEQTEK works through a structured five-phase approach, starting with a Define and Align phase that produces a current-state technology assessment, a capability and maturity analysis, and a gap report before any tool gets purchased.
That specialized data and AI expertise reduces risk in early-stage decisions—especially for organizations without an in-house BI team yet.
The Five Stages of Business Intelligence Maturity
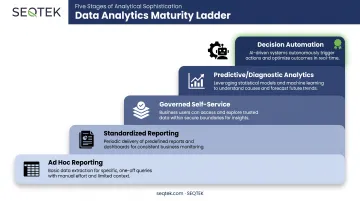
Most organizations sit somewhere on this ladder, whether they've mapped it or not:
| Stage | Characteristics |
|---|---|
| 1. Ad hoc reporting | Spreadsheets, manual pulls, no consistency between teams |
| 2. Standardized reporting | Recurring reports exist, but still largely manual |
| 3. Governed self-service | Certified datasets let teams explore independently |
| 4. Predictive/diagnostic analytics | Machine learning and forecasting layered onto BI |
| 5. Decision automation | Systems trigger actions directly from data signals |
Stages 1 and 2 describe where most companies start: someone in finance owns a master spreadsheet, and half the org trusts it. Stage 3 is the real turning point, where IT stops being the bottleneck because certified, governed data lets teams self-serve without breaking trust.
Stages 4 and 5 require mature infrastructure and genuine AI/ML integration, and most organizations need outside expertise to get there. This isn't a leap you make in a single quarter. TDWI's Analytics Maturity Model notes that only a small fraction of organizations reach the most advanced level, where analytics runs on tuned infrastructure with established governance already baked in.
SEQTEK's data architecture and AI readiness consulting typically enters at Stage 2 or 3, helping clients build the governed foundation needed before layering on predictive analytics or automation.
Common Challenges in BI and Big Data Strategy Implementation
Three problems show up in nearly every BI initiative, regardless of industry.
Data quality and integration issues. Disconnected systems and inconsistent metric definitions create the classic "whose numbers are right" argument. Gartner research puts the average cost of poor data quality at $12.9 million per year, yet 59% of organizations still don't measure data quality at all.
Low user adoption. This usually traces back to a disconnect between what IT built and what teams actually needed. The fix: start small. Ship one dashboard that solves one real problem for one team, then expand.
Scalability limitations. As data volume grows, tools chosen for today's needs become tomorrow's bottleneck. Choosing platforms designed for growth, not just current volume, prevents a rebuild eighteen months in.

Organizations facing these issues often benefit from an outside, unbiased perspective. SEQTEK provides technology evaluation for clients across manufacturing, healthcare, and financial services.
In one healthcare engagement, disparate data sources, unreliable file ingestion, and compliance gaps were the starting point. The work added Power BI reporting, folded compliance into daily workflows, and introduced alerting so issues were caught before they became crises.
An outside view often surfaces the blind spots internal teams stop seeing.
Frequently Asked Questions
What are the four pillars of business intelligence?
The four pillars are data infrastructure, governance, analytics tools, and organizational culture. Each one supports the others: strong infrastructure without governance just produces fast, untrustworthy numbers.
What are the five stages of business intelligence?
Organizations typically progress from ad hoc reporting to standardized reporting, then governed self-service, predictive analytics, and finally decision automation. Most companies sit in the first two or three stages.
Is business intelligence the same as ETL?
No. ETL is a data preparation process that feeds the warehouse that BI tools analyze. It's a component of the BI ecosystem, not a synonym for BI itself.
How long does it take to implement a BI strategy?
A focused, single-department initiative can show results in 60 to 90 days. Enterprise-wide rollouts touching multiple systems and departments typically take 6 to 12 months.
What is the difference between BI strategy and big data strategy?
BI strategy focuses on reporting and decision support using existing structured data. Big data strategy addresses managing and analyzing high-volume, high-velocity, often unstructured datasets at scale.
How do I measure the success of a BI strategy?
Track leading indicators like time-to-insight and adoption rate alongside lagging indicators like decision latency and measurable business outcomes. If adoption is low, the strategy needs adjusting regardless of how polished the dashboards look.